In 2013 a total of 23 963 animals were sold at the 67 official SA game auctions included in the unit’s database generating a total turnover of R1,029 billion. The exceptional increase in average prices of plains game groups and the many high-value animals and colour variants that were traded on official sales, contributed to the highest official game auction turnover in history.
Not only did these auctions reach the billion rand mark, but they also achieved the most record prices in a specific year. During the year, 32 groups achieved record prices and of these, several improved the record more than once. These exclude groups offered at official auctions for the first time. With the processing of the data, exceptional cases, such as the R40 million buffalo sold in Limpopo to an Eastern Cape buyer, were not taken into account. Interpreting average prices is further complicated by continual change and growth in the industry, which leads to notable price differences within specific groups, such as male or female.
These price differences can be partly ascribed to specific genetics, with exceptional animals fetching exceptional prices. One example is kudu bulls with horns of 55’’ and more, of which the average price was five times that of bulls below 55’’. Livingstone eland cows sold for between R10 000 and R890 000. The statistics also indicate that established, well-known breeders with specific genetics are more likely to reach above the industry average.
Table 1:Average auction prices: 2011 to 2013
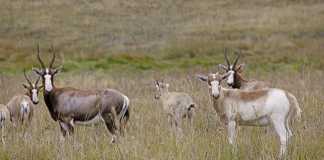
Compared with previous years, the prices of plains game groups increased significantly, partly ascribed to the high prices of adult males, specific genetics and the weak rand. Most colour variants experienced a year of two halves. The prices of, among others, ‘golden’ wildebeest and ‘golden’ gemsbok (Oryx), decreased during the first eight months of 2013. Then in August, the number of animals sold or offered at auctions, especially ‘golden’ wildebeest and ‘golden’ gemsbok, dropped, resulting in a slight upward movement in prices during the second half.
The average prices of ‘golden’ wildebeest and ‘golden’ gemsbok ended lower compared to those obtained in 2012, although a new record price was set for a ‘golden’ wildebeest bull. The price of black impala continually increased through the period under review. The sustained price increase was partly due to the fact that ‘black’ impala, given the size of the investment and breeding dynamics of the animals, arguably provide higher return on capital compared to other high-value groups and colour variants. Other high-value game species have also shown an upward trend since 2012.
Table 2: Record auction prices: 1991 to 2013
Buffalo genetics
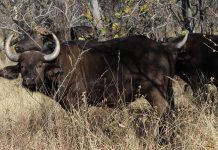
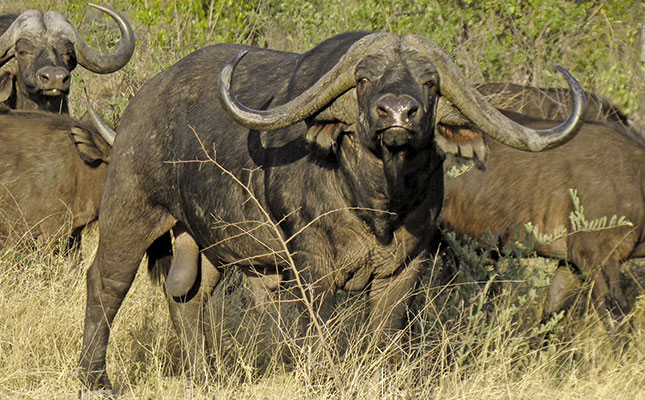
Interesting is the price trend of East African buffalo. Although several of these, especially those with specific genetics, have reached prices close to the 2012 average, the overall average auction prices for 2013 are lower in comparison. This questions whether the market is reacting to DNA findings that there is no genetic difference between lines of buffalo.
In other words, in future, a premium could be paid for specific genetics rather than a specific genetic line.
Table 1 gives an overview of the average prices for the past three years. The average prices for 2013 represent 67 official auctions held in different provinces. Table 2 shows the highest prices for the different groups over the past 21 years. In 2013, several groups either equalled their highest prices or improved.
Phone Dr Flippie Cloete on 018 299 4245. This list is based on an artificial marketing system used at game auctions. These terms do not necessarily meet the requirements for scientific accuracy and it must be borne in mind that colour variants are not a subspecies.

