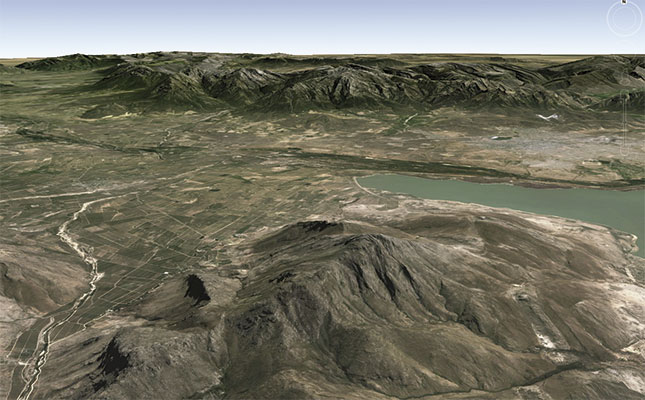
Photo: Google Earth
Last week, we suggested that you create four maps of your enterprise called farm mapping, the first three were:
- The pre-farming map – to show what your farm originally looked like.
- The current view map – to show what your operation looks like now, depicting how the land is used or not used.
- The ‘thought’ map – to indicate the actions you plan to take on various parts of your farm.
- The next step was to compare these and note the differences. By doing this, you start thinking and acting as an owner/manager rather than as an employee, empowering yourself to change your way of doing business.
READ:Electronic mapping
Things you need to know about Farm mapping
Optimised conditions
Now that you have a much better idea of what you need and why, it’s time to draw up a detailed ‘optimised conditions’ map. This will indicate all the areas and features requiring different actions outlined and linked in location and shape to the factors affecting the situation on the ground.
This fourth map is a summary of what you must do and where, in order to optimise the return on your property. Give each area a tracking or identification number and list it as you map it. Include information such as basic improvements to fencing, water supplies, stock handling facilities and sheds, or changes in land use – converting veld to crops or switching crops, for example.
Convert to digital
To get full value from your land, convert the preceding ‘paper process’ into a geographical information system (GIS) format. Visit the government’s free AGIS site and play – don’t be afraid to make mistakes. The maps and the decision-making capability show what to expect when you begin to map your property formally and add the operational data to make better decisions faster and boost your profits.
“I carry a Trimble GeoExplorer, a high-end GPS,” says Ben. “I can programme it with the features that I expect to see and operate it in several different modes. It downloads directly into GIS after post-processing. This means I can go to work on what I want from the site and how I want to manage it as a consequence. I then add imagery from the new WorldView2 satellite via GeoTerraImage in Pretoria.”
The imagery has a 50cm ground resolution and captures conditions using eight spectral bands. Different combinations of the bands enable you to assess conditions on the ground, as well as what’s on the ground. Do not be intimidated. If you are not ready for GIS, nevertheless draw up the four maps, as it will help you to plan for the future.
More about farm mapping
A ‘topo-cadastral’ map shows elevations and landforms as well as aspects such as property boundaries needed for legal documents (cadastre). Such maps are free on Google Earth. You can zoom in as close as individual houses then zoom out to view both your and neighbouring farms. Google Earth Pro provides more capability, although it requires an annual subscription.
South Africa also has free farm mapping tools on the Internet and the data to support them, such as farm boundaries and recent imagery. Current countrywide aerial photography is also available at a reasonable price.
Eight spectral bands and 50cm resolution allow you to map – in detail – wet vs dry sections, high productivity vs low productivity, and many other factors that directly affect your livelihood. The detail is similar to that of high-resolution aerial photography.
If you prefer using free imagery, try USGS GloVis. Almost all of the older satellite imagery held by the USA is free. Get imagery from different times of the year and during different periods of wet-dry cycles. You might be surprised at how it changes your management and sense of the resources that you think you know well. If you wish to have a map to hold in your hands, you can download and print out any of the topo-cadastrals.
Where to go
The following will help you draw up the maps:
- Google Earth: earth.google.com.
- Free SA mapping tools: www.agis.agric.za/agisweb/agis.
- WorldView2 Satellite Imagery (South Africa): www.satimagingcorp.com/satellite-sensors/worldview-2.
- SA aerial photography: Chief Directorate, National Geospatial Information (CD:NGI): www.ngi.gov.za.
- USGS GloVis: http://glovis.usgs.gov.
- Topo-cadastrals: www.ngi.gov.za/index.php/Image-tabs-home/maps-and-geo-spatial-information
Email Ben Breedlove at [email protected].
This article was originally published in the 14 February 2014 issue of Farmer’s Weekly.

