South Africa is one of the few countries using an integrated bioresource programme (BP), which has applications in farming and land use planning, ensuring sustainable natural resource use and food production.
“The BP is a predictive, analytical tool for farmers,” says Cobus Botha, Natural Resource Section specialist researcher. “It includes the type of farming system, recommended production intensity, veld production, the potential for wildlife farming, and the crop production potential.”
The BP uses a Geographic Information System (GIS) to collate datasets on natural resources – topography, climate, soil and vegetation. This data is packaged into a programme where it can be used to plan resource use at provincial, municipal and farm level.
The foundation of the programme is data collected over 30 years and research conducted by KZN Department of Agriculture, Environmental Affairs and Rural Development’s (DAEA) Natural Resources Section, and it’s continually updated. However, the BP currently lacks the soil data needed to improve its accuracy at farm level.
Satellite imagery adds valuable real-time data. Land cover and land use are assessed this way, providing information on an area and monitoring its crops, underutilised and high-potential land, and the degradation of natural resources. Remote sensing assesses appropriate land use, identifying areas of high conservation value to be set aside to preserve biodiversity.
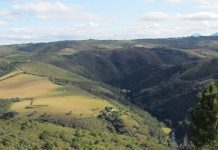
KZN was divided into 622 Bioresource Units (BRU), with a sufficiently homogeneous soil type, climate, altitude, terrain form and vegetation. Appropriate land use and production practices are defined for each BRU, which will have a unique code indicating rainfall, altitude and location. A BRU can be identified down to farm level.
A report on your farm
Farmers can request BRU information for their farms in a user-friendly report. This can be used for current and future management plans. The report covers the location and extent of the BRU, as applicable to the farming operation. Specific information on the BRU’s general agricultural production potential is included, and more details can be generated after soil characteristics are mapped, by the farmer, a consultant or an agricultural extension officer.
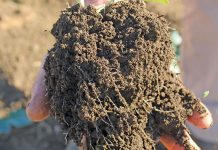
Appropriate production techniques are then recommended based on soil information, along with an overview of threats or constraints on future developments. Climate can limit potential for diversification or expansion, and the report makes suggestions based on local climatic conditions. With a soil analysis done, the BP shows the soils’ strengths and weaknesses for agricultural purposes.
“The site for any activity must be carefully selected to avoid degrading the natural resource,” a typical report advises. A BP report also describes a BRU’s natural resources, its total area (in hectares), altitude range, predominant and secondary terrain types, and indications of its percentage slope. It classifies the main vegetation type and patterns of vegetation within this, and gives indicator plant species and a breakdown of percentages within the entire BRU.
Water resources such as rivers and wetlands will be mapped. “All this describes the general agricultural suitability of the particular BRU,” says Cobus.
The most suitable crops are also recommended, providing average expected maximum and minimum yields. A farmer growing maize in a particular BRU might not know that cabbages, potatoes and carrots could also achieve respectable yields there. Based on the BRU’s characteristics, the report could suggest alternative crops like barley, lima beans or even truffles.
A report breaks down a BRU’s typical climate according to rainfall, temperature, relative humidity, heat units, chill units, evaporation, sunshine and frost severity, all valuable infromation. Typical veld data and related information includes average grazing capacity, ideal burning time, average grazing and resting percentages and duration.
“It can model potential changes in yields due to climate changes. Much of the available data can be presented in map form so users can see characteristics at a glance. More detail is available in text and graph formats,” continues Cobus. “This information is available for free to any farmer in KZN. Farmers need only provide the farm’s location. Farmers in other provinces could benefit if they had similar programmes.”
Contact Cobus Botha on 033 355 9391 or e-mail [email protected].

