

Grain marketing can be complicated, as producers need to address two critical questions before a final marketing decision can be made: when is the optimal timing to market their grain, and how much of the expected harvest should be allocated to each marketing activity?
Several grain marketing strategies have been proposed to assist producers in their decision-making process. One common strategy is to follow a routine that involves marketing the expected crop in three segments, evenly spaced throughout the production season and consistently at the same time each year.
Complex technical analysis strategies have also been suggested to assist grain producers in their marketing decisions. However, these strategies often fall short due to their complex nature and inability to adjust to changing market conditions.
Considering these limitations, the Department of Agricultural Economics at the University of the Free State conducted an in-depth investigation to suggest an alternative preharvest marketing strategy that is both straightforward to implement and adaptable to changing market conditions.
In the early 1980s, several studies investigated the moving average crossover strategy (MAC) in the grain market of the US and found that this strategy dominated other grain marketing strategies. Based on the positive results of the MAC strategy in the US grain market, an optimised MAC strategy was developed specifically for the South African maize market.
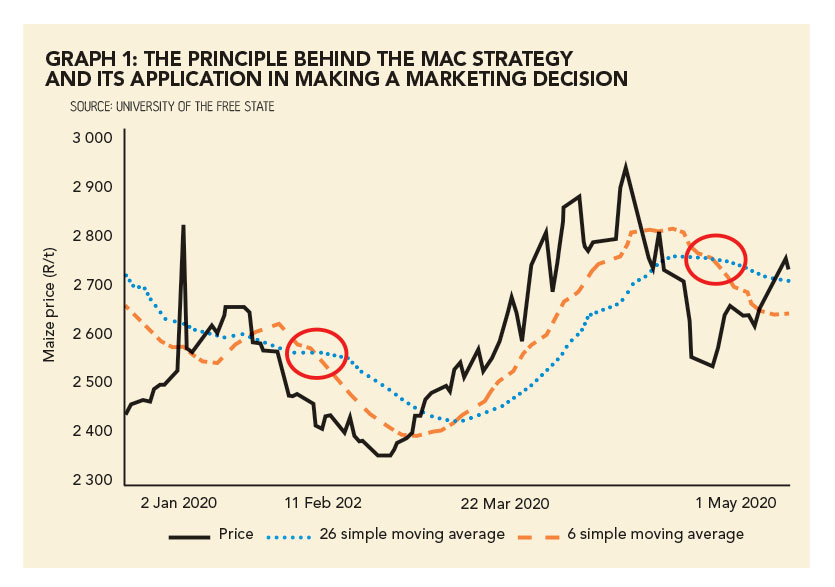
Principle behind the strategy
Graph 1 illustrates the principle behind the MAC strategy and its application in making a marketing decision. A sell signal is generated when the shorter-day moving average crosses the longer-day moving average from above.
Previous studies have not addressed three important questions regarding the MAC strategy. Firstly, the optimal moving average combinations to be used in applying the MAC strategy have not been identified.
Secondly, the optimal quantities of grain to be marketed with each marketing signal generated by the MAC strategy have also not been ascertained.
Lastly, previous studies assumed that producers are risk-neutral, whereas research proves that producers are more likely to exhibit risk-averse behaviour.
The study period spanned over 11 marketing years from 2009/10 to 2019/20 and was conducted on the May white maize futures contract. The MAC strategy was optimised by identifying the optimal moving average combinations and the optimal quantities to be marketed with each marketing signal generated by the optimal MAC strategy.
As it is unrealistic to assume that all producers have the same risk preferences, the MAC strategy has been optimised for a risk-neutral and risk-averse producer; that is, two optimal MAC strategies have been developed.
The results of this study, summarised in the table on the right, indicate that the optimal MAC strategy for a risk-neutral producer consists of the 26-day and 6-day moving averages.
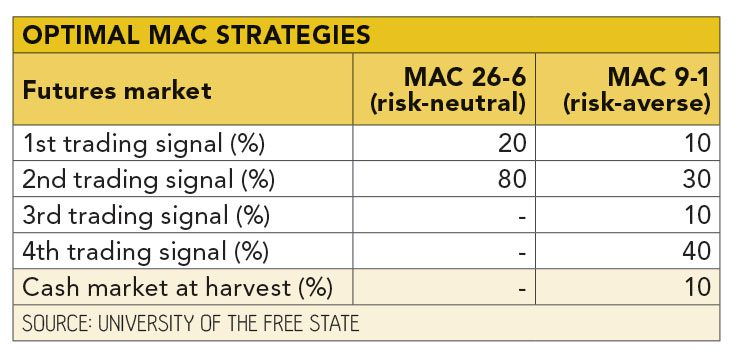
To effectively apply the 26-6 MAC strategy, it is recommended to market 20% of the expected harvest at the first generated signal, leaving the remaining 80% to be marketed at the second trading signal.
The optimal MAC strategy for a risk-averse producer consists of the 9-day and 1-day moving averages.
According to the results, the recommended approach to implement the 9-1 MAC strategy effectively is to sell 10% of the expected harvest at the first trading signal, 30% at the second signal, 10% at the third signal, and 40% at the fourth signal. The remaining 10% of the expected harvest is sold on the cash market at harvest time.
A visual analysis was conducted by plotting the trading signals generated by the crossover strategies across the 11 marketing years. The objective was to identify an optimal marketing window for each of the developed MAC strategies.
A significant number of marketing signals generated by the 9-1 MAC strategy occurred early in the 11 marketing years.
The early marketing pattern associated with the 9-1 MAC suggests that producers whose risk appetite is low will perform better by marketing their maize early in the production season.
Marketing signals were generated by the 26-6 MAC strategy across 11 marketing years. No clear optimal marketing window could be identified for a risk-neutral producer, as marketing signals generated by the MAC 26-6 were more spread over the 11 marketing years.
The conclusion was that a risk-neutral producer would perform better by marketing consistently throughout the production season rather than focusing on a specific period.
After identifying the two optimal MAC strategies, their performances were compared with previously proposed routine marketing strategies.
The routine strategies considered in the comparison include: (1) marketing the total expected harvest during planting time (PLANT); (2) dividing the marketing into three equal segments throughout the production season (THIRDS); (3) marketing the total expected harvest during planting time with a put option (PUT); and (4) not engaging in active marketing and selling the entire crop on the spot market at harvest time (SPOT).
Graph 2 shows by how much rand per ton the optimal MAC strategies outperformed the routine strategies for different levels of risk-aversion coefficients (ARAC). ARAC is the extent to which a producer is risk-averse and is indicated on the X-axis of Graph 2.
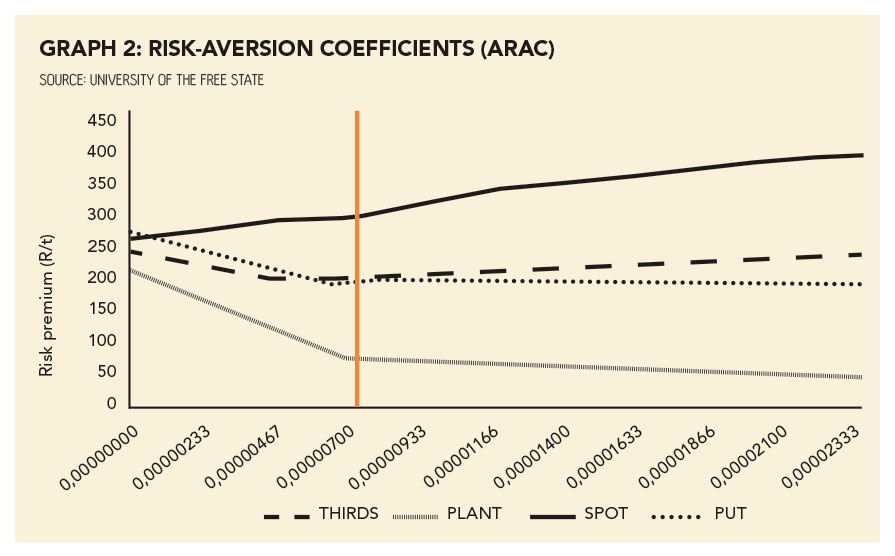
An ARAC value of 0,0000000 represents risk-neutral producers, and an ARAC value of 0,00002333 represents highly risk-averse producers. The 26-6 MAC strategy dominated the other strategies for ARAC levels between 0,00000 and 0,000007, which is sensible, as the 26-6 MAC strategy is optimal for risk-neutral producers.
Regarding ARAC levels above 0,000007, the 9-1 MAC strategy dominated the other strategies, which again makes sense, as the 9-1 MAC strategy is optimised for more risk-averse producers.
A risk-neutral producer (ARAC = 0,00000000) employing the 26-6 MAC strategy would have outperformed the PUT, SPOT, PLANT and THIRDS strategies by an average of R265/t, R248/t, R205/t and R232/t respectively over the 11 marketing years.
On the other hand, a risk-averse producer (with ARAC = 0,00002333) employing the 9-1 MAC strategy would have achieved higher average performance over the 11 marketing years, surpassing the SPOT, THIRDS, PUT and PLANT strategies by R395/t, R226/t, R182/t and R32/t respectively.
Conclusion
The study’s results reaffirmed previous findings that grain producers who do not carry out any active marketing usually perform the worst. However, the results of the study do not suggest that the optimal MAC strategies are a new golden recipe for success.
Rather, the results highlight the need for producers to reconsider their marketing approaches and steer away from suboptimal strategies that are overly complex, not adaptable to changing market conditions, and do not align with their risk preferences.
Email Markus Monteiro [email protected].


