
In August, food and non-alcoholic beverages inflation reached 1,1% year-on-year (y/y), against headline consumer inflation of 4,4%. The Bureau of Food and Agricultural Policy’s (BFAP) latest brief, compiled with Absa Agribusiness and released on 30 September, puts those encouraging consumer numbers alongside persistent production costs and the steep price of a healthy diet.
For farmers, abundant supplies and lower commodity prices can squeeze returns. For households, slower price increases don’t undo years of accumulated costs. Therefore, keeping food affordable depends on both purchasing power and viable farms.
Reading the rates correctly
The annual food and non-alcoholic beverage (NAB) inflation rate rose from 0,9% in July to 1,1% in August, an increase of 0,2 percentage points (pp), while headline inflation increased by 0,2pp, from 4,3% to 4,4% over the same period (see Figure 1).

Year-on-year comparisons measure prices against the same month a year earlier. Month-on-month (m/m) comparisons measure changes from the preceding month. In August, food and beverage prices increased by 0,1% from July, while headline prices were unchanged.
These measures can move differently. Fruit and nut prices rose by 2,7% m/m yet remained 5,5% below August 2025 levels. A monthly increase can therefore coexist with an annual decline.
Inflation also measures the pace of price change rather than affordability. A low positive rate means prices are still rising, albeit slowly; it doesn’t mean the basket has become cheap.
Why meat matters more than fish
Fish and seafood recorded annual inflation of 7,5%, followed by NAB at 4,9%. Oils and fats saw 2,6%, dairy and eggs 2,1%, sugar and related products 2%, and meat 1,5% (see Figure 2).
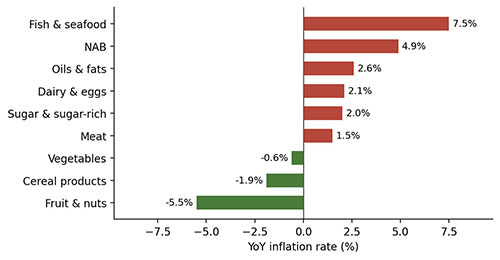
Vegetables were 0,6% cheaper y/y, grain products were down 1,9%, and fruit and nuts were 5,5% cheaper. These declines helped contain the overall inflation rate.
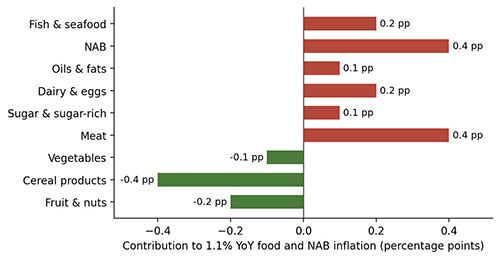
However, the fastest price increase doesn’t necessarily contribute the most to inflation. Stats SA weights categories according to their share of household expenditure. Meat carries a much larger weight than fish, so a smaller meat price increase can have a bigger effect.
BFAP’s rounded calculations show meat and NAB each adding about 0,4pp to annual food inflation. Fish contributed about 0,2pp, while grains’ decline subtracted about 0,4pp.
These are contributions in percentage points, not separate inflation rates for each category. Figure 3 covers selected categories and omits ‘other food’, so its bars don’t fully reconcile with the 1,1% food inflation rate.
Pressure at the farm gate
BFAP reports that maize prices increased for a second consecutive month in August, although they remained below the levels seen a year earlier. Higher export parity prices supported the monthly movement, while a stronger rand, abundant yields, and large stocks cushioned it.
For fresh produce growers, weak demand adds another concern. BFAP describes tomato prices under pressure from elevated stocks, as well as considerable variability in onion prices. Discounting can move perishable produce through markets, but higher volumes don’t necessarily compensate producers for lower prices or increased handling costs.
Shelf inflation alone cannot establish whether farmers are earning enough. Producer receipts, yields, input bills, finance costs, and marketing expenses determine that calculation.
The gap between farm and retail prices doesn’t automatically represent profit either. Processing, transport, packaging, refrigeration, losses, and retail operating costs must be taken into consideration. Assessing who captures value requires comparable products and evidence across the value chain.
A healthy diet remains expensive
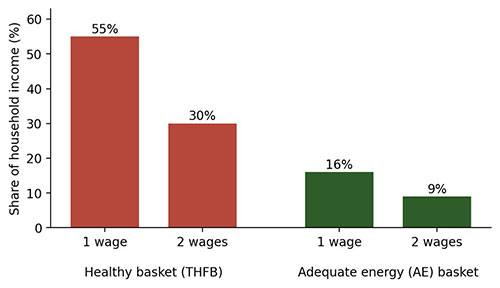
BFAP’s basic healthy food basket (THFB) contains 26 items across all food categories for a South African household of two adults and two children. In August, this basket cost R3 935, about R30, or 0,8%, less than in July.
The bureau’s adequate energy basket (AE) for the same household cost R1 155 in August. The THFB was therefore roughly 3,4 times more expensive, a difference of R2 780. The AE basket supplies sufficient calories without the dietary diversity built into the healthy model.
For a household supported by two full-time minimum wages and two child support grants, the THFB represented about 30% of the income modelled. With one minimum wage and two child support grants, it represented about 55% (see Figure 4).
These percentages describe modelled affordability and not measured spending by every household. They also assume full-time employment, which cannot be taken for granted.
Cheaper maize meal and rice can ease budgets, but higher prices for items such as canned pilchards, cooking oil, and some vegetables can still restrict dietary variety. A subdued average conceals those different experiences.
Relief after a difficult cycle
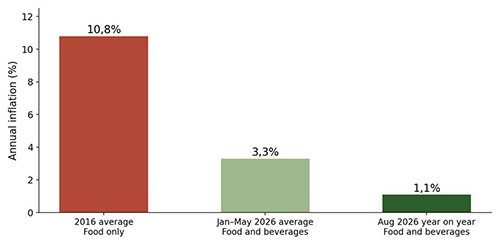
Annual food and beverage inflation reached 14% in March 2023. The 1,1% in August 2026 shows how substantially that pace has slowed, without reversing the earlier rise in price levels.
The 2015/16 drought provides another warning: food-only inflation averaged 10,8% in 2016. Care must be taken when making historical comparisons, because food-only measures differ from those of food and beverages, and annual averages differ from an individual month’s annual rate.
The early months of 2026 also show the direction of travel. BFAP researchers reported average annual food and beverage inflation of 3,3% from January to May (see Figure 5). This is a five-month average of annual rates, rather than a cumulative price increase over those months.
Outlook and expectations
BFAP expects food commodity prices to stay moderate in the coming months, but the following upside risks remain”
- Maize prices: maize prices rose for a second month on higher export parity prices, as Northern Hemisphere weather and Black Sea shipping disruptions raised global supply concerns. A strong rand, the record 2026 harvest, and high stocks cushioned the rise, and prices remain lower y/y.
- Fuel and electricity: m/m fuel inflation eased in August on a stronger rand, but the Central Energy Fund projects under-recoveries for petrol and diesel into October, which typically signals higher pump prices. US–Iran ceasefire talks and the rand/dollar rate will decide the outcome. Eskom’s 8,7% electricity tariff increase, effective 1 April, also lifts costs along the value chain.
- Meat: beef prices are moderating as foot-and-mouth disease (FMD) vaccinations increase slaughter volumes, while lower feed costs are pushing chicken prices down. BFAP expects meat prices to keep trending lower as FMD and avian influenza vaccinations progress.
- Vegetables: tomato prices are under pressure from elevated stocks, onion prices are volatile, and potato prices are normalising. Warmer weather and seasonal supply shifts will influence prices in the coming months.
- El Niño: a predicted super El Niño could cut summer crop yields heading into 2027, putting upward pressure on food prices over the medium term. Carryover stocks from two bumper seasons should provide a buffer.
- Repo rate: a 25 basis point (0,25 pp) increase raises borrowing costs, adding to fuel and fertiliser pressure if Middle East tensions persist.
- Sources: Bureau for Food and Agricultural Policy. 30 September 2026. Food Inflation Brief – August 2026 Prices. BFAP; Statistics South Africa. 23 September 2026. Consumer Price Index August 2026. Stats SA; Statistics South Africa. 19 April 2023. ‘Inflation rises for a second consecutive month as food prices bite’. Stats SA; Van Reenen, N, Matomane, L, Dunstan, C. December 2025. The Drivers of Food Price Inflation in South Africa. Southern Africa – Towards Inclusive Economic Development.