

You arrive at Nampo Harvest Day with a number in mind. Maybe it is R2 million for a new tractor, or perhaps a monthly repayment figure that your business can realistically carry. But at the showgrounds, that figure quickly starts to lose its meaning.
Every stand offers a different angle: 0% interest, no deposit required, deferred payments, or extended terms designed to soften the financial impact. On paper, every offer looks attractive, but in practice, comparing them becomes a blur of percentages, repayment structures, and fine print.
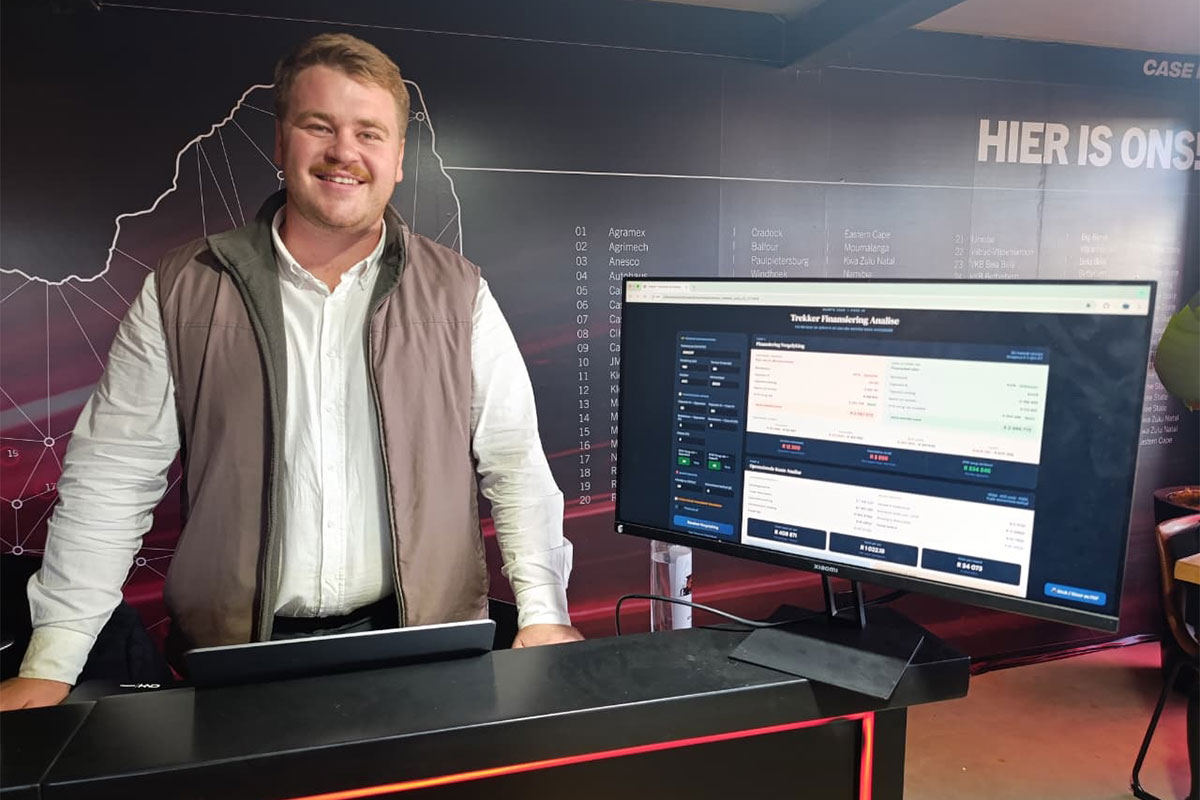
That is where Visser comes in. Two months ago, he decided to develop a comparative tool to help farmers cut through the fluff and compare the actual cost of different deals on a like-for-like basis. The idea started as a simple Excel spreadsheet exercise but soon evolved into a structured model called the Total Cost of Ownership Analysis.
“The model aims to help farmers identify the best possible deal and not end up in a situation where they cannot keep up with repayments and are forced to sell a machine at a loss,” Visser told Farmer’s Weekly at the CASE IH stand at Nampo 2026, where he was based.
Hidden costs
According to Visser, many farmers tend to focus primarily on yearly instalments when comparing finance offers, but this can hide a deal’s true long-term cost. A lower repayment may simply mean a longer finance period, a larger balloon payment at the end of the term, or significantly higher interest costs over time.
His analysis also shows how payment holidays or deferred-start structures can be misleading. In some cases, shifting from four annual payments to three by deferring the first year may look like short-term relief, but it often ends up being more expensive.
This is because interest continues to accumulate on the full capital amount during the payment-free period, increasing the total cost of the loan once repayments begin.
Visser’s model goes beyond the financing structure itself by incorporating total ownership and operating costs, as well as estimated resale value at the end of the machine’s life.
Total ownership and operating costs
Ownership costs include insurance, licensing, finance charges, storage, and depreciation. These are unavoidable expenses that continue whether the tractor is working every day or standing idle in a shed. Depreciation, in particular, can quietly erode value over time and is often underestimated when farmers plan capital purchases.
Operating costs add another layer. Fuel is usually the biggest component, but servicing, tyres, filters, hydraulic components, and unexpected breakdowns all contribute to the final bill. During peak seasons, when machines are under heavy pressure, these costs can escalate quickly, especially if downtime disrupts critical operations.
When all of these factors are combined with financing terms and resale value, the total cost of ownership can look very different from the headline price at the stand. In some cases, Visser said, the ‘cheapest’ deal on paper turns out to be one of the most expensive over the life of the machine.
“You need to incorporate these costs, because there is little value in owning a machine that you cannot afford to maintain and operate,” he added.
His model also allows farmers to test different promotional structures side by side, whether that is a low-deposit offer, a zero-interest deal, or a higher-deposit option with lower financing costs.
“The difference in total cost between promotions can be significant once all variables are accounted for,” he explained.
Cost analysis
To illustrate this, Visser compared two finance deals for a 140hp tractor that would be financed over 36 months and used for 500 hours across 1 500ha per year.
Under the first deal, the farmer would pay a 20% deposit (R400 000) and qualify for a zero-interest loan but would have to repay the VAT portion (R260 870) to the finance company.
Under the second deal, the farmer would qualify for a 6% interest rate if they paid a 35% deposit (R700 000) upfront.
If both tractors cost R2 million, in the first scenario, the farmer would end up paying a total of R2 million on the loan, with annual repayments of about R533 333.
Under the second scenario, however, the total cost would amount to about R1,86 million if the VAT refund were used to reduce the capital amount owed. Annual repayments would come to roughly R487 853.
Visser then added a second layer to the analysis by incorporating ownership and operating costs, including fuel, maintenance, insurance, and depreciation. This pushed the annual cost of the tractor up by an additional R403 165.
He also demonstrated the impact of deferred-payment structures. In one example, a loan of R1,6 million increased to more than R1,72 million when the first repayment was only made 15 months later. This pushed the annual repayment to R700 792, compared with R463 522 when repayments began immediately.
The total repayment cost under the deferred-payment structure amounted to around R2,33 million, with interest costs of R327 179. By comparison, the total repayment without a payment holiday amounted to a little over R2,25 million, with interest costs of R254 087.
While the deferred-payment option may initially appear attractive because it postpones repayments, Visser said the analysis shows how quickly additional interest costs can accumulate when capital remains unpaid for extended periods.
Plans for the future
The tool drew a lot of attention at Nampo, where farmers and sales teams began running deals through the system to compare them in real time.
For Visser, the aim is not to discourage investment in machinery but rather to force a more honest conversation about affordability.
“In times like these, cash flow is king, and if we can help farmers avoid buying machines they cannot truly afford, or help them structure a better deal, then we have done our job,” he said.
His plan is to use feedback gathered during Nampo to further refine the model before eventually making it available to farmers and dealers as a practical tool for comparing machinery finance offers.


