

Due to a continuing rise in the human population associated with an increased demand for protein, sustainable beef production is becoming more important to meeting long-term needs. Natural resources are also under pressure and beef producers have to produce the proverbial ‘more from less’.
In South Africa, the livestock sector is also a major role player in the conservation of biodiversity through a variety of well-adapted indigenous and non-indigenous breeds, as well as rare game species. South Africa’s beef industry is challenged by globalisation, increasing volumes and competition, strong industrialisation of the value chain, shortage of skilled staff, and pressures to meet changing customer needs.
Over the past years, the beef supply chain has become vertically integrated. This is where the producer, feedlot, abattoir and wholesaler are linked. There are different value and supply chains. The direct participants who play a role in delivering the product to the market are farmers, feedlots, abattoirs, wholesalers, processors, distributors and retailers.
Other participants in the beef value chain include meat processors, and providers of hides and skin, imports and exports, spices, packaging and so on.
The supply chain is also determined by the characteristics of the beef product and is very competitive. The partners and role players in this chain are highly dependent upon each other.
The slaughter, processing and preservation of meat are key components of the meat-industry value chain.
Changing dynamics
The combination of decreasing hectares available for crop production, increased utilisation of grain for fuel, increased input costs and a rise in feed costs are some of the key factors that highlight the changing dynamics of agriculture.
Due to high feed costs, it’s important to have a positive feed margin. This is influenced by the feed price and the efficiency of growth (gain/kg feed consumed). A better margin can be achieved by improving the average daily gain (ADG) and reducing the feed costs. This in turn can be achieved by breeding animals that utilise feed more efficiently.
Feed costs amount to between 55% and 70% of the total production cost. A 10% improvement in feed efficiency of animals may result in a feed-cost saving of several hundred million rand per annum for the industry as a whole.
Measuring efficiency will assist in decisions that increase productivity without increasing
costs of production and result in greater profit margins. Feedlot studies in the US demonstrate that a 10% improvement in ADG as a result of a 7% increase in intake improved profitability by 18%, whereas a 10% improvement in feed efficiency saw a 43% increase in profits.
Improving feed efficiency will thus significantly contribute to a more sustainable and profitable production system.
Feed conversion ratio (FCR) is the amount of feed needed to gain 1kg of live weight. FCR is one of the traits calculated at the end of all Phase C tests at Agricultural Research Council (ARC) test centres.
Bulls consume on average 3% of their body weight in feed per day and the average FCR in South Africa is 4,5kg to 7,5kg, which is the actual feed consumed to gain 1kg in live weight. The less feed consumed by a bull to gain weight, the more efficient it becomes.
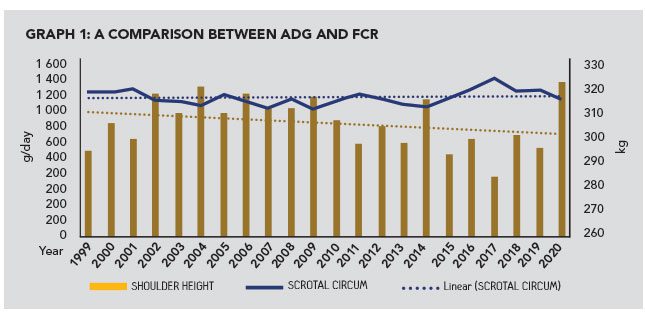
There is a highly negative (favourable) correlation between ADG and FCR (-0,6). The better the growth of the animal, the more efficient (lower) the FCR will be. When the feed intake of the animal increases, the rate of growth of the animal will also be enhanced, causing the correlated response in ADG.
Monetary value
Genetic improvement in feed efficiency can be achieved through selection, and correlated responses in growth and other post-weaning traits will usually be minimal.
Because feed efficiency is important to improve profitability, the feed efficiency in young animals may differ from the efficiency of older, fatter cattle on a high-energy feedlot diet. Feed efficiency is heritable and genetic improvement is thus possible through selection.
When a producer selects for a low FCR and high ADG, the animals will become bigger over time, requiring more feed for gaining weight, growth and maintenance. As growth is of economic importance, weaning weight has a direct monetary value; farmers select for this trait to improve their profitability.
Care, however, should be taken when selecting for higher weaning weights, since growth traits are highly correlated. Care should also be taken to avoid heavier calves at birth, as this might result in calving difficulties, while heavier mature weights will require an increase in maintenance requirements.
The feedlot industry produces approximately 75% of all beef in South Africa. This is about 1,35 million head per annum. With most of the meat on the formal markets in South Africa being produced from cattle in feedlot systems, feed efficiency becomes crucial. A 1% improvement in feed efficiency has the same impact as a 3% increase in rate of weight gain.
Improvements in efficiency of beef production are vital and necessary to sustain the cattle industry.
Results of study
The purpose of this study was to determine how the growth and efficiency of Santa Gertrudis bulls have changed over 20 years.
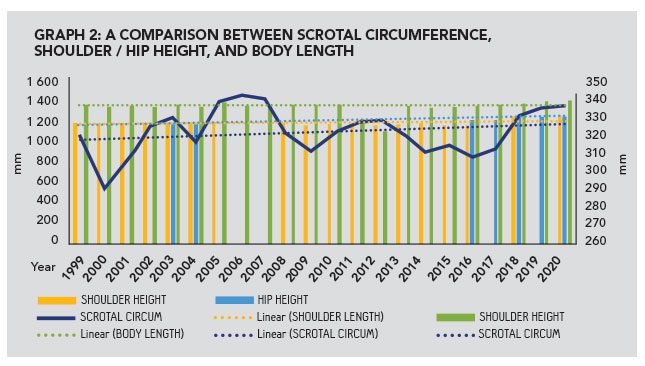
In 2014, the Santa Gertrudis Society moved away from measuring shoulder height to hip height. The global trend is to focus more on residual feed intake (RFI), as it’s phenotypically independent of growth and body weight. The trait is also moderately heritable (between 18% and 49%). This enables us to improve feed efficiency by selecting for efficient animals. RFI is the difference between actual and predicted feed intake.
The latter is an animal’s maintenance requirements in relation to its body weight and growth. It may be more desirable to select for a trait such as RFI, since selecting for high ADG and low FCR will result in bigger animals with higher maintenance requirements.
The bulls’ frame size remained relatively unchanged during the test period.
As the average FCR increased by only 200g, other factors that also could have an influence, such as genetics, feeding practice, environmental control or health status, must be taken into account. Although there was a slight decrease in the ADG in the period assessed, this must be managed, as the faster an animal gains weight, the quicker it is ready for market, which can decrease input costs.
Scrotal circumference
The scrotal circumference increase is a positive outcome. Scrotal circumference is correlated with sperm motility and morphology and a good indicator of daily sperm production, especially in young bulls.
These results were obtained over a 20-year period from different bull test centres and are clear indicators of phenotypical trends for the different traits that are of economic importance.
Bulls between the ages of 15 and 250 days are tested in a Phase C test. Performance data from four ARC testing stations were analysed by the ARC in this study and Santa Gertrudis bulls tested between 1999 and 2020 were included. During the phase C test, the growth (ADG) and the efficiency (FCR) of bulls were measured.
On the final day of the test, body measurements (body length, hip height, skin thickness and scrotal circumference) were taken. Breed inspectors also had to approve the bulls according to the breed requirements. The animals were fed a standardised feed during the test period and received feed ad lib.
The bulls were grouped according to the year within which their adaptation period of 28 days started; this was because most of the bulls were not tested in groups. Data from 1 199 Santa Gertrudis bulls, obtained from the Integrated Registration and Genetic System, were analysed.
After the adaptation period of 28 days, the bulls entered the intensive growth test stage for an 84-day period.
Upon completion of this, the results were compared with the 10-year rolling average for ADG and FCR per station and per breed. The 10-year rolling average is the average of the performance of the bulls (within a breed) tested within the previous 10-year period.
This is done to compensate for the environmental effect on performance. By comparing animals with the 10-year average, the effects of the environment were eliminated from the results.
In addition, the management and feed ratio were standardised at all the central ARC testing centres.
Email Melville Ferreira at [email protected], or Yolanda Venter at [email protected].


