
Land reform statistics have been a source of controversy and confusion in South Africa. Why is this?
Deductions are often wrong, either because the data on which assumptions are based is incorrect, or the people who gathered and analysed the data have limited insight into land reform. Then, you also have people who manipulate information to suit their political agendas.
How or why might data be wrong?
A good understanding of agriculture, the geography, economics, history and politics of an area is required to spot and avoid mistakes. A person with such understanding would know that a farm in the Karoo might constitute over 1 000ha, while one closer to Stellenbosch in the Western Cape would probably be smaller than 100ha.
I have seen in some reports that ‘metres’ were erroneously replaced by ‘hectares’ without conversion, resulting in impossible numbers.
Can you give examples of such reports?
Statistics South Africa’s (Stats SA) census on commercial farmers, which is done every few years, is flawed with mistakes because it does not accommodate the possibility that a farmer might own more than one farm or be registered for VAT for more than one property.
Instead, each farm and VAT-registered entity is counted as a different farmer.
The same applies to government’s land audit of 2017, which argued that only 4% of privately held land was in black ownership. This data has been broadly quoted and used to illustrate the discrepancy between black and white ownership and to support arguments that land reform was taking too long.
The problem is that the audit only applied to rural land registered at the Deeds Office in 2015 to individual owners. It excluded individually owned urban land, which might be small in terms of area but not in value, as well as the significant proportion of private land in trusts, [as well as land owned by] companies and community-based organisations.
How do we know that your report is any better?
I initially began an audit out of personal interest to make sense of all the nonsense about landownership. As other stakeholders, such as Agri SA, became involved, it grew into an extensive nationwide audit.
My data is based on sales transactions from the Deeds Office combined with land transfer and restitution data from what previously was called the Department of Agriculture, Land Reform and Rural Development.
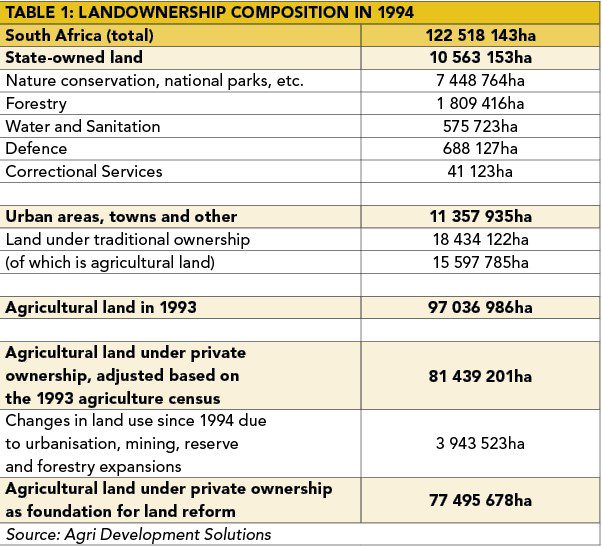
So, what was the state of agricultural land ownership in 1993?
South Africa covers an area of 122,5 million hectares. Roughly 97,04 million hectares of the land was used for agricultural purposes back in 1994, of which 81,4 million hectares belonged to the commercial sector, according to Stats SA’s agriculture census of 1993.
The remaining 15,595 million hectares were under traditional ownership or in development trusts. Of this, 28,5% was situated in the Eastern Cape, 23,2% in KwaZulu-Natal, 20,5% in Limpopo, 11,6% in North West and 10% in the Northern Cape. Only 1,2% was found in the Free State and 0,5% in Gauteng, while none of this land was situated in the Western Cape.
Over time, 3,94 million hectares of agricultural land has been lost to development, leaving roughly 77,5 million hectares for land reform [see Table 1].
What has happened since? How much progress has been made with land reform?
The aim with land reform is to get 30%, equating 23,2 million hectares, of agricultural land under black ownership by 2030.
Over the 30 years up until 2024, a total of 84,5 million hectares of land has been traded, totalling R621 billion in value. An added 35 million hectares have been transferred, with commercial farmers accounting for 11,5 million hectares and the Department of Land Reform and Rural Development for 11,1 million hectares of this.
Roughly 19,534 million hectares or 25,2% of the targeted land have been redistributed, which means that we have already achieved 84% of the land reform target. This land is 43,3% of the value of agricultural land in the country [see Table 2].
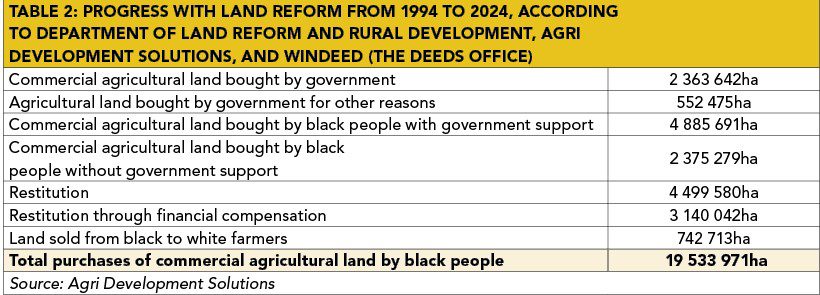
Can you give a breakdown of how the redistributed land was acquired?
Government bought 2,36 million hectares of agricultural land and another 552 000ha for other purposes. Another 6,6 million hectares were bought or transferred through government programmes, while black people bought 2,4 million hectares of agricultural land without any government support.
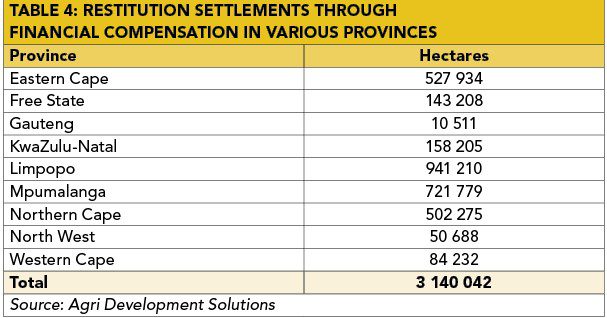
Along with this, financial compensation was paid for restitution claims against 3,1 million hectares of land, while up to 4,5 million hectares have been transferred under restitution claims.
What did you find most interesting about these statistics?
Two things. Firstly, the 3,1 million hectares for which financial compensation was paid is substantially more than the 2,36 million hectares government bought for land reform. This shows that most people in South Africa do not want land for agricultural purposes, or where it is offered to them. People want land where it is convenient for them and to do with what they want to.
Secondly, slightly more land was bought by black people without government support than the number of hectares bought by government. To me this shows that people who want to farm, regardless of race, will find a means to realise this dream.
Based on this, there is no need for amendments to the Expropriation Act, and specifically expropriation without compensation.
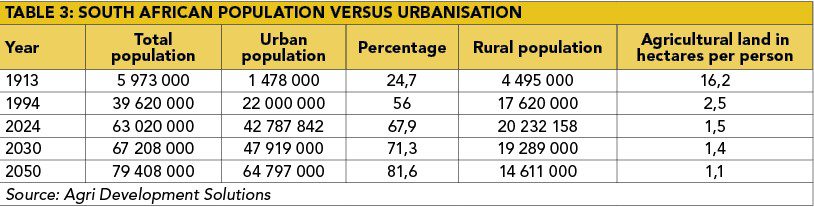
You also looked at population growth and urbanisation in your report. What did you see?
The South African population grew by 59% from 39,62 million people in 1994 to 63 million people in 2024. Sixty-two percent of the population is between 15 and 34 years old.
The rate of urbanisation increased from 56% in 1993 to 67% in 2024.
The population is expected to reach 67,2 million people by 2030, of which 71,3% are expected to be urbanised, and 79,4 million by 2050, of which 81,6% are expected to be urbanised.
What does this have to do with agriculture?
Besides the impact of urbanisation on rural communities, the agriculture sector will compete with people for land. The availability of agricultural land already declined by 4,3% between 1994 to 2024, and it is estimated that roughly 12% more land would be needed to keep the same population density in 2030 as in 2024, and 51,4% more to do so by 2050.
Solid economic growth, services and food supplies will be needed to support the growing population [see Table 3].
Can you give a breakdown of what happened in terms of land restitution?
Progress with land restitution is good. Noteworthy, four provinces accounted for 83,7% of claims: Limpopo accounted for 29,3%, Mpumalanga for 21,4%, the Eastern Cape for 17,6%, and North West for 15,5%.
Roughly 30,9% of settlements took place between 2017 and 2019, after which the pace of settlements declined to roughly 90 000ha per year.
Of the restitution claims, 81,8% are allocated in four provinces, namely the Northern Cape, KwaZulu-Natal, Limpopo and North West. Just over 60% of these claims were settled between 2007 and 2016 [see Table 4].
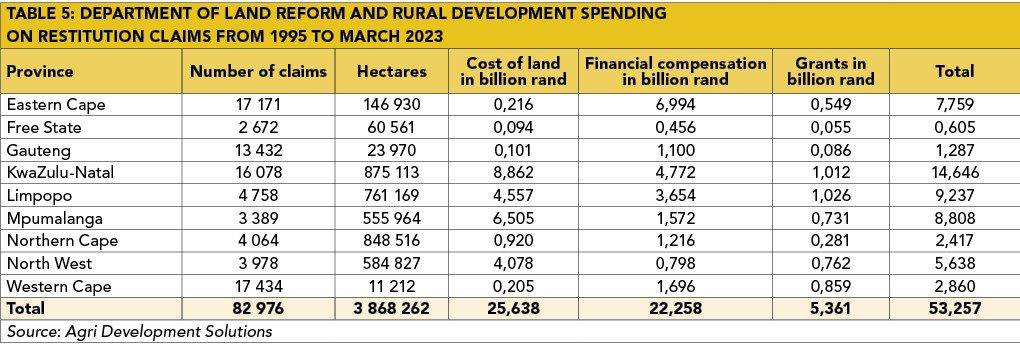
Did your analysis reveal anything interesting about the cost of land?
According to information supplied by the Department of Land Reform and Rural Development, R53,257 billion [was spent] on land reform up until March 2023. Of this, R25,638 billion was to buy land and R22,258 billion for financial compensation. Another R5,362 billion was for grants. According to government, 3,868 million hectares were settled in the process.
There is an apparent preference for land in Mpumalanga, Limpopo and North West, where the average prices for compensation are also substantially higher than in the rest of the provinces.
The total cost per claim paid is about R2 598 997 in Mpumalanga, R1 941 362 in Limpopo, R1 417 295 in North West, R594 734 in the Northern Cape, R451 897 in the Eastern Cape, R226 442 in the Free State, R164 047 in the Western Cape, and R95 816 in Gauteng. As such, the cost per claim averages around R641 846.
About 86,5% of spending was centred in five provinces, being 54,7% of the total claims and 75,6% of the hectares. Of these, KwaZulu-Natal represented 27,5%, Limpopo 17,3%, Mpumalanga 16,5%, the Eastern Cape 14,6%, and North West 10,6%.
Roughly 70% of the financial compensation went to the Eastern Cape (31,4%), KwaZulu-Natal (21,4%) and Limpopo (16,4%) [see Table 5].
How much agricultural land is currently under black ownership?
In 2024, this amounted to 37,8% if former homelands and trust and tribal lands are included [see Table 6].
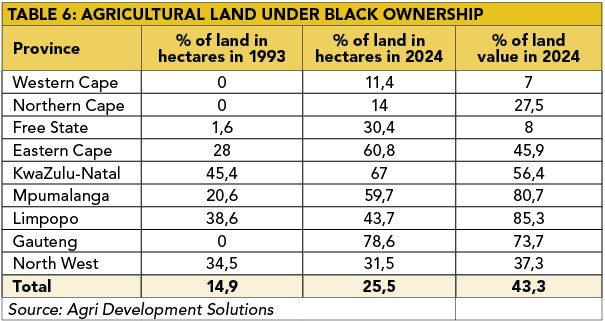
In the Eastern Cape, 60,8% of the land is under black ownership, and 67% of the land in KwaZulu-Natal, 59,7% of the land in Mpumalanga, 43,7% of the land in Limpopo, and 78,6% of the land in Gauteng.
In terms of value, black people own 56,4% of the agricultural land value in Kwazulu-Natal, 80,7% of Mpumalanga, 85,3% of Limpopo, and 73,7% of Gauteng.
Besides the high-potential land in the former homelands and trust and tribal lands, it is evident that black people prefer land with a historical and or lifestyle element to it.
What did you see in terms of the size of land being traded?
It is clear that most black people (39%) buy land that is smaller than 50ha, and roughly 18% buy land that is between 50ha and 150ha in size.
In contrast, most commercial transactions (54%) involve land that is between 50ha and 300ha in size, and 26% involve land that is bigger than 600ha.
About 40% of government transactions took place in the category that includes farms greater than 600ha in size, while only 10% of these transactions involved land smaller than 50ha.
What did you see in terms of resales?
Between 1994 and 2024, the speed at which land was resold was 1,1 times that of the speed at which land was bought. It was found that black owners who bought their land privately resold 36,4% of their agricultural land, and 48,9% of land transferrals were sold.
And what prices were realised?
Commercial farmers paid an average price of R11 868/ha for agricultural land, compared to government that paid R8 985/ha and black private buyers who paid R18 913/ha. This shows us that market-related prices were paid for land.
Taking all of this into account, how achievable is the 30% land reform target?
It is achievable, but government is under severe pressure, which means it will have to look at alternative ways to reach the target. The agriculture sector has already come to the table with public-private partnerships, aimed at empowering previously disadvantaged farmers and upscaling them into commercial producers.
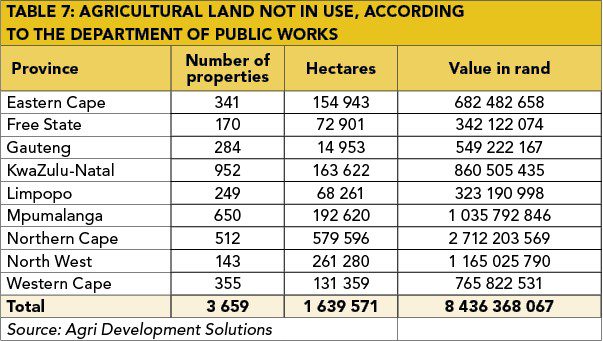
Government, according to the Department of Public Works, might also consider using the more than 12 000 unused properties under its ownership, comprising over 1,9 million hectares, to address this need [see Table 7]. Most of these properties are found in North West, Mpumalanga, KwaZulu-Natal, and the Western and Eastern Cape.
For future sustainability and food security purposes, efforts should also be taken to unlock the full agricultural productive potential of land that has been transformed, as well as agricultural lands under traditional ownership.
These lands are at least 29,1% of the agricultural potential of the industry, and amount to a loss of R188,9 billion in GDP if not developed to their full potential.
For more information email Johann Bornman at [email protected].


